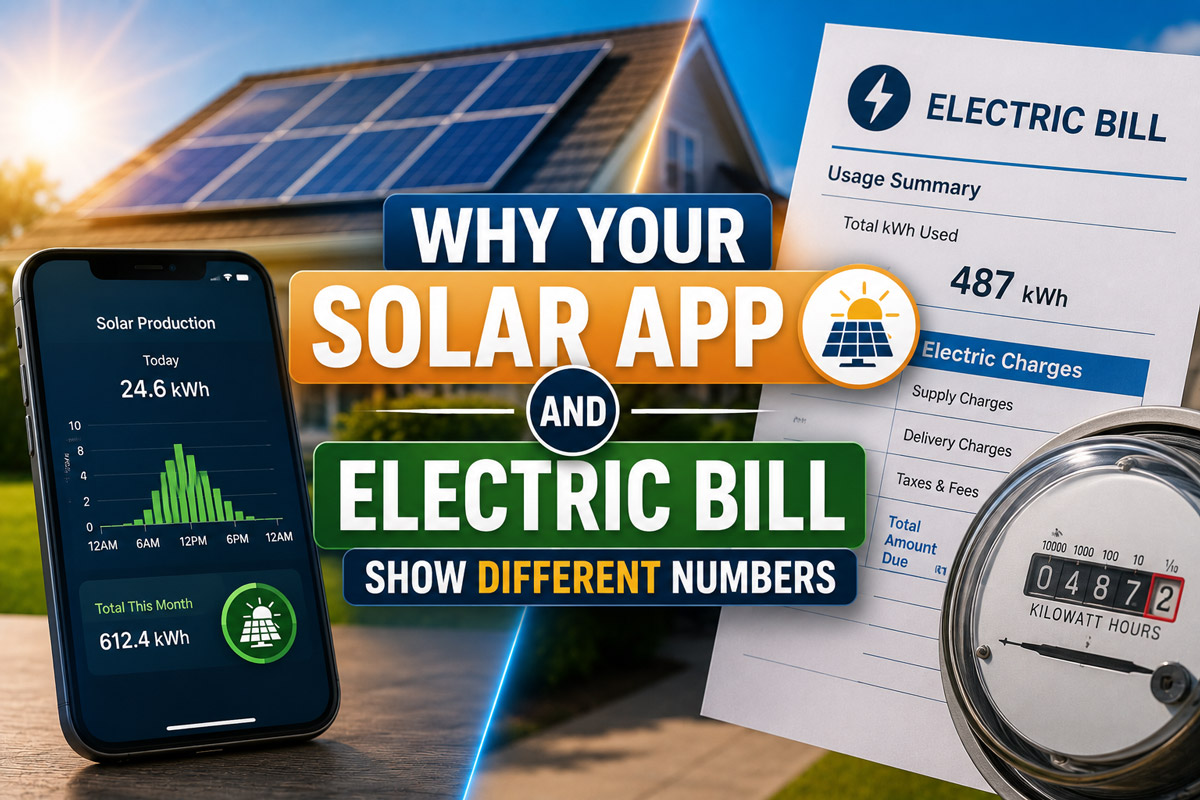
It is one of the most common moments of panic for new solar owners: you open your monitoring app, see that your system produced a massive 800 kilowatt-hours (kWh) last month, and then open your utility bill only to see a credit for 300 kWh.
Did the electric company miscalculate your generation? Is your inverter malfunctioning?
The short answer is no. Your solar system is likely working perfectly.
The discrepancy comes down to a fundamental difference in what your solar app and your electric company measure, where those measurements take place, and how energy flows through your home.
The Core Difference: Gross Production vs. Net Export
To understand the mismatch, you need to understand the path electricity takes from your roof to the grid.
Your solar monitoring app tracks gross production. It counts every single unit of energy generated by your solar panels right at the inverter.
Your electric bill, on the other hand, tracks net grid exchange. Your outdoor utility meter sits at the boundary of your property. It has no visibility into what happens inside your house—it only records electricity moving across the property line.
Feature Comparison
| Feature | Solar Monitoring App | Utility Electric Bill |
|---|---|---|
| Primary Metric | Gross Energy Production | Net Energy Flow (Import vs. Export) |
| Measurement Point | At the solar inverter/microinverters | At the outdoor bi-directional smart meter |
| Behind-the-Meter Usage | Included (shows total raw power) | Excluded (cannot see energy consumed inside) |
| Timeframe | Real-time & Exact Calendar Months | Variable 28–33 Day Billing Cycles |
5 Reasons Your Numbers Don’t Match
1. Behind-the-Meter Self-Consumption (The Missing Piece)
When your solar panels generate electricity during a sunny afternoon, that power flows straight into your home’s breaker panel first. Your home gets “first dibs” on that energy. If your air conditioner, refrigerator, or TV are running, they consume that solar electricity instantly.
This is called self-consumption. Because that power was consumed inside your home, it never touched the utility meter on the outside wall.
- Example: Your panels generate 25 kWh on a Tuesday. Your home consumes 18 kWh during the day to power appliances.
- Your App Shows: 25 kWh produced.
- Your Bill Shows: 7 kWh exported to the grid.
- The “Missing” 18 kWh: That is free energy you used directly without buying it from the grid.
2. Mismatched Billing Dates
Solar apps typically default to showing production for standard calendar dates (e.g., June 1 to June 30).
Utility companies rarely read meters on the first day of the month. Your utility billing cycle might run from June 12 to July 11. Comparing a calendar month in your app to a offset billing cycle on your electric statement will create a noticeable data gap every single time.
3. Time-of-Use (TOU) and Grid Imports
Solar energy is generated during the day, but peak household energy demand usually occurs in the evening after the sun sets.
Unless you have a solar battery, your home draws power from the utility grid at night. Your utility bill will reflect this “imported” power as a line item charge. Even if your total monthly production equals your total monthly consumption, you may still owe money if your utility uses Time-of-Use (TOU) rates—where evening grid power costs significantly more than the value of daytime exports.
4. Mandatory Connection Fees and Fixed Charges
Many homeowners expect a $0 electric bill once solar is installed. However, remaining connected to the power grid incurs overhead. Most utility companies charge fixed monthly fees (often listed as connection fees, grid access charges, or basic service fees) regardless of how much power you generate or export.
Key Takeaway: Your solar panels generate kilowatt-hours, not dollars. Fixed administrative fees, taxes, and service charges cannot be offset by solar production credits in most territory frameworks.
5. Data Reporting Delays and Latency
Solar monitoring systems upload generation data over home Wi-Fi or cellular connections in set intervals (e.g., every 5 to 15 minutes). Smart utility meters log data on different schedules and batch-upload it to utility servers daily. Temporary syncing delays can cause short-term variance between your app dashboard and your online utility portal.
How to Verify Your System’s Performance
If you want to ensure your utility company is tracking your data accurately, follow these steps:
- Align Your Dates: Check the exact service dates on your utility bill (e.g., May 14 to June 13). Open your solar app, navigate to the custom date filter, and set the exact same date range.
- Check for Consumption CTs: If your solar app only shows a single line for “Production,” ask your installer if Consumption Current Transformers (CTs) were installed. Consumption CTs allow your solar app to track real-time home energy usage, showing you exactly how much solar power was used locally versus sent to the grid.
- Calculate Self-Consumption: If you have production and export numbers, use this simple formula to calculate how much power you used directly:
To help narrow down your specific situation, tell me a bit more about your system setup:
- Which solar monitoring app are you currently using (e.g., Enphase, Tesla, SolarEdge)?
- Do you have a home storage battery installed?
- Is your primary concern a higher-than-expected bill, or are you trying to align the specific kWh numbers?