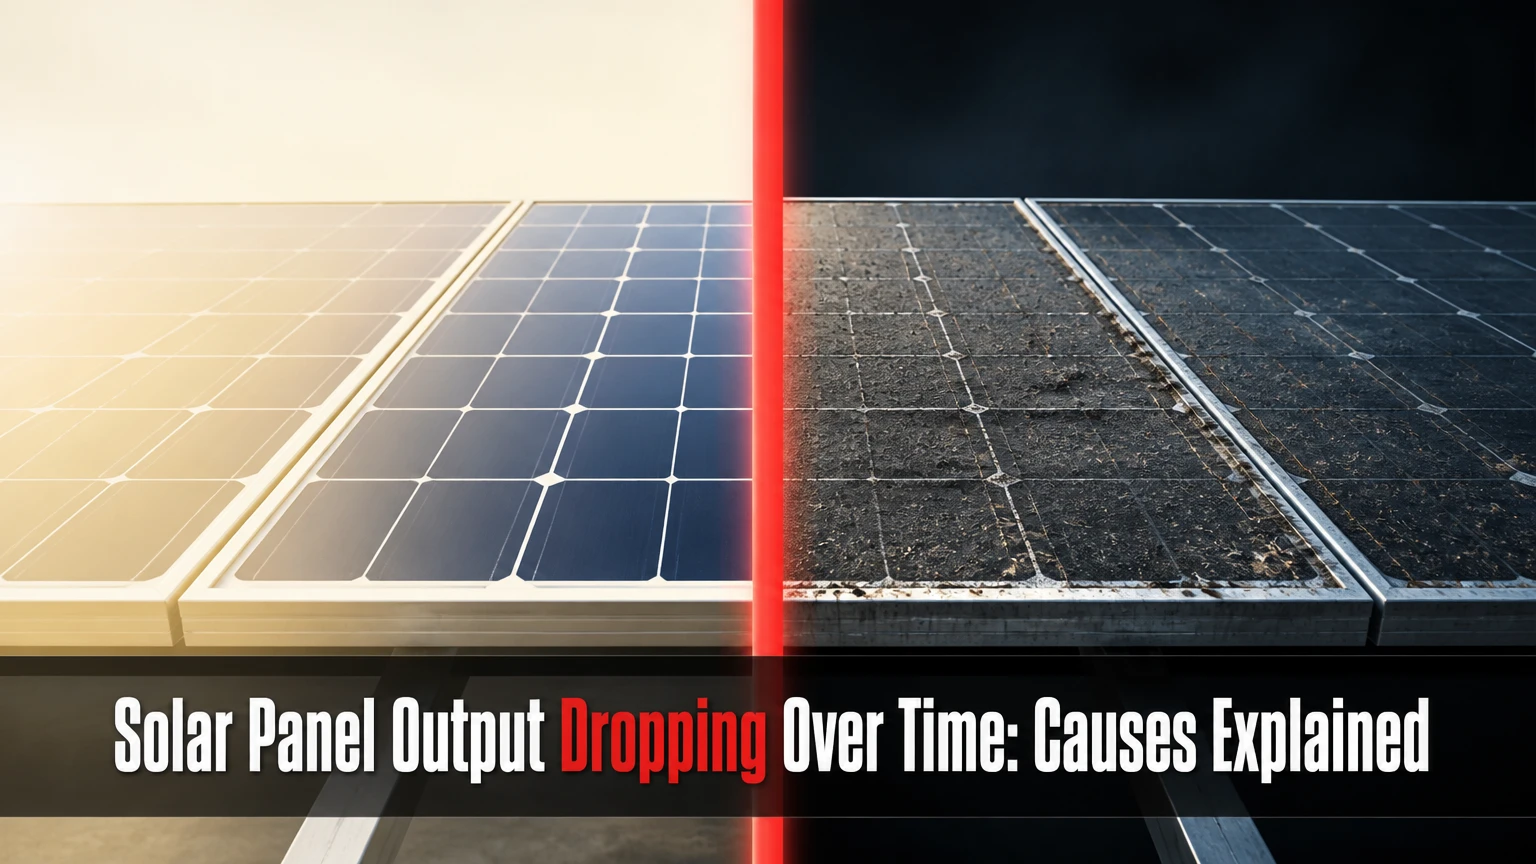
Solar panel output dropping over time usually results from normal photovoltaic degradation, which averages about 0.5% per year after initial stabilization. Faster losses commonly come from soiling, shade, inverter faults, potential-induced degradation, moisture ingress, or cell damage, so production data must distinguish permanent module decline from temporary system problems.
Key Facts at a Glance
Solar panels commonly lose about 0.3%-0.8% of rated power per year after the first year.
P-type PERC modules can lose 1%-3% through early light-induced degradation.
N-type TOPCon and HJT cells largely avoid conventional boron-oxygen LID.
A sudden system-wide drop usually indicates soiling, shading, an inverter fault, or a monitoring problem rather than normal aging.
The NREL review by Dirk Jordan and Sarah Kurtz reported, “The median degradation rate for all data sets was 0.5%/year.”
A panel with delamination, severe hotspots, or persistent insulation faults may need replacement even when its measured annual decline looks modest.
What Is Solar Panel Degradation?
Solar panel degradation is the permanent reduction in a photovoltaic module’s maximum power output caused by changes in its cells, conductors, encapsulant, backsheet, or electrical interfaces. A 400-watt panel losing 0.5% annually would produce approximately 398 watts after one year of stabilized operation and about 352 watts after 25 years under the same test conditions.
Normal aging is gradual. A sudden 15% production loss in one month is not normal module degradation, even if the array is several years old.
The NREL degradation review by Jordan and Kurtz, published in 2013, analyzed thousands of degradation measurements and found a median rate of 0.5% per year across the complete dataset. Field results vary because climate, cell architecture, installation quality, operating voltage, and measurement methods vary.
Permanent and temporary losses differ
Dirt, snow, pollen, bird droppings, and shade reduce sunlight reaching the cells, but they do not necessarily damage the module. Production can recover after cleaning, snow melt, tree trimming, or inverter repair.
Permanent degradation remains after the surface is clean and the system is operating correctly. A valid degradation estimate therefore compares weather-adjusted production or measured module power across several years, rather than comparing two unadjusted monthly bills.
Why Does Solar Panel Output Drop Over Time?
Solar panel output falls as ultraviolet radiation, moisture, temperature cycling, electrical bias, and mechanical loading alter the photovoltaic materials. Silicon cells generate less usable current when defects trap charge carriers, resistance rises in conductors, or moisture corrodes contacts.
The main mechanisms are:
- UV exposure breaks down polymers in the encapsulant and backsheet.
- Heating and cooling expand glass, silicon, solder, and polymers at different rates.
- Repeated stress creates microcracks and weakens solder joints.
- Moisture reaches cell edges or conductive layers through damaged seals.
- Electrical potential drives leakage currents or ion migration.
- Cell defects reduce charge collection and increase resistive heating.
The result may be lower current, lower voltage, or both. Current-related losses often affect irradiance response, while resistance-related failures become especially visible under high operating current and can create hotspots.
Which panel materials are most vulnerable?
Encapsulant discoloration reduces the light reaching the cell. Ethylene-vinyl acetate, commonly called EVA, can yellow or form acetic acid under certain combinations of heat, UV exposure, and moisture. Modern encapsulants and glass-glass construction can reduce these risks, but product quality and edge sealing still matter.
Backsheet cracking has a separate consequence. A cracked polymer backsheet can expose conductive components, increase moisture entry, and create an electrical safety hazard. The module may continue producing power while its insulation resistance becomes unacceptable.
What Are the Main Types of Solar Panel Degradation?
The principal types are light-induced degradation, potential-induced degradation, mechanical damage, and environmental aging. These categories can overlap, and one damaged module may show several mechanisms at once.
| Degradation type | Typical onset | Main mechanism | Common symptom |
|---|---|---|---|
| LID in P-type cells | Hours to weeks | Boron-oxygen defects reduce carrier lifetime | Early 1%-3% power reduction |
| LeTID in some P-type cells | Months to years | Light and elevated temperature activate defects | Continued decline after initial stabilization |
| PID | Months to years | Voltage-driven leakage and ion migration | String mismatch, low current, low insulation |
| Mechanical degradation | Immediate to years | Microcracks, broken ribbons, solder fatigue | Hotspots, snail trails, inactive cell areas |
| Environmental aging | Years to decades | UV, moisture, corrosion, delamination | Yellowing, bubbles, corrosion, backsheet cracks |
How much does LID reduce output?
Light-induced degradation, or LID, causes a fast initial reduction, commonly around 1%-3% in older or conventional P-type silicon modules. Boron and oxygen in the silicon form electrically active defects under illumination, reducing the lifetime of charge carriers before they reach the cell contacts.
N-type TOPCon and HJT cells use different doping structures and largely avoid conventional boron-oxygen LID. They can still experience other forms of light- and elevated-temperature-induced degradation, so “LID-free” should not be treated as “immune to every early loss.”
What is PID and can it cause major losses?
Potential-induced degradation is electrical damage associated with high voltage between cells and the grounded frame or other system components. Sodium-ion migration, leakage paths, and surface polarization can reduce power, particularly in humid conditions and arrays with unfavorable system voltage or grounding characteristics.
Severe PID can produce losses above 10%, and field cases may approach 30% or more. That is a failure condition, not a normal annual degradation rate. PID-resistant module design, correct inverter configuration, suitable grounding, and recovery equipment can reduce risk.
PID sometimes improves after nighttime reverse-bias treatment or dedicated recovery equipment. Recovery is not guaranteed, and a module with corrosion or permanent cell damage may not return to its original rating.
How Do Panel Technologies Compare for Long-Term Output?
N-type TOPCon and HJT modules generally offer lower warranted degradation than conventional P-type PERC modules, while thin-film products have distinct temperature and degradation characteristics. The warranty document and measured field data matter more than a technology label alone.
| Technology | Typical first-year loss | Typical later annual loss | Approximate year-25 power |
|---|---|---|---|
| P-type PERC | 1.5%-3.0% | 0.45%-0.70% | 80%-86% |
| N-type TOPCon | 0.5%-1.5% | 0.25%-0.40% | 87%-92% |
| HJT | 0.3%-1.0% | 0.20%-0.35% | 88%-93% |
| CdTe thin film | 1.0%-3.0% | 0.30%-0.70% | 82%-90% |
| CIGS thin film | 1.0%-4.0% | 0.50%-1.00% | 75%-86% |
These figures are typical planning ranges, not a guarantee for every manufacturer or climate. A warranty may use a stepped schedule, such as a larger first-year allowance followed by a fixed annual percentage, rather than a single linear rate.
Does heat accelerate solar panel degradation?
High temperature reduces instantaneous voltage and can accelerate chemical and solder fatigue over many years. A module with a temperature coefficient of -0.30% per degree Celsius loses less operating voltage as cell temperature rises than one rated at -0.40% per degree Celsius.
Heat also interacts with humidity and voltage. A hot, humid rooftop can create more demanding conditions than a dry location with the same annual sunlight. Adequate ventilation, reliable encapsulation, and a low temperature coefficient help, but they cannot eliminate aging.
Which Conditions Accelerate Output Loss?
Moisture, heat, salt mist, hail, wind loading, repeated snow loads, poor installation, and wildfire ash can accelerate degradation. The risk depends on exposure duration and whether the condition damages the module or merely blocks sunlight.
| Condition | Temporary output effect | Permanent risk | First inspection |
|---|---|---|---|
| Dust or pollen | 2%-15% typical | Low unless abrasive buildup persists | Clean surface and compare irradiance |
| Snow cover | 0%-100% during coverage | Low, except load or sliding damage | Check frame, mounts, and glass |
| Coastal salt mist | 1%-10% before cleaning | Corrosion at connectors and contacts | Inspect connectors and frames |
| Hail impact | 0%-100% on damaged modules | Glass fractures and cell cracks | Visual and electroluminescence test |
| Tree shade | 5%-50% on affected sections | Hotspots under poor bypass conditions | Compare shade timing and string data |
| Wildfire ash | 5%-30% before cleaning | Glass abrasion and chemical residue | Professional low-abrasion cleaning |
| Roof heat and humidity | Variable | Encapsulant, solder, and PID stress | Review temperature and warranty data |
Walking on modules can create microcracks without breaking the front glass. Cold-water cleaning is not automatically harmful, but spraying a large temperature difference onto hot, damaged, or defective glass increases thermal-shock risk. Use manufacturer instructions, avoid abrasive tools, and never apply pressure to the laminate.
How Can You Tell Normal Degradation From a Fault?
Normal degradation is gradual, broadly consistent across comparable modules, and usually remains within the performance warranty curve. A fault is more likely when production drops suddenly, one string diverges from the others, or module temperature and electrical readings become abnormal.
| Production pattern | Likely cause | Confidence from pattern alone | Next test |
|---|---|---|---|
| Whole array drops overnight | Inverter, grid, monitoring, or weather event | Medium | Check inverter alarms and utility status |
| One string remains low | String fuse, connector, PID, or shading | Medium | Measure string current and voltage |
| One module runs hot | Hotspot, diode, crack, or connector | High | Thermal image and electrical inspection |
| Monthly output declines slowly | Soiling, shade growth, aging, or climate | Low | Clean, normalize weather, compare years |
| Output returns after rain | Dust or pollen | High | Inspect coating and soiling pattern |
| Voltage is normal, current is low | Shading, cell damage, or irradiance issue | Medium | I-V curve and irradiance measurement |
A monitoring portal reports system behavior, not definitive module degradation. Inverter clipping, changing export limits, battery charging priorities, communication failures, and utility outages can all imitate panel aging.
What do visual symptoms mean?
Snail trails are narrow brown or silver lines often associated with cracked cells, moisture, or metallization changes. They indicate a condition worth testing, but visual appearance alone cannot quantify lost watts.
Bubbles, fogging, yellowing, and edge separation suggest delamination or encapsulant deterioration. Cracked glass, exposed conductors, and burned junction boxes create safety concerns and require a qualified technician rather than routine cleaning.
How Should You Diagnose Dropping Solar Output?
Diagnose a declining solar array in six stages, beginning with data and reversible causes before ordering module tests. A homeowner can complete the first three stages in 30-60 minutes, while electrical testing usually requires a qualified solar professional.
Step 1: Verify the production data
Compare daily and monthly kilowatt-hours with the same months from prior years. Record inverter uptime, clipping, utility outages, battery behavior, and any changes in export limits.
Use weather data from a nearby station or satellite service. A cloudy month cannot prove degradation.
Step 2: Check for new shade and soiling
Inspect roof obstructions, tree growth, pollen, dust, bird droppings, snow, and ash. Clean only when the manufacturer permits it, using low-pressure water and a soft non-abrasive implement.
You will know this step helped when output improves under comparable sunlight. A persistent gap after cleaning points elsewhere.
Step 3: Separate array-wide from localized loss
Compare string currents, module-level monitoring, and inverter MPPT channels. An array-wide loss suggests irradiance, inverter, grid, or system-level conditions; one weak string suggests a conductor, fuse, connector, PID, or shading problem.
Step 4: Inspect safely from the ground
Look for cracked glass, browning, delamination, backsheet fractures, corrosion, loose hardware, and burned connectors. Do not disconnect energized connectors or walk on modules.
Step 5: Order electrical and thermal tests
A technician can perform I-V curve tracing, insulation resistance testing, string voltage checks, and infrared thermography under suitable sunlight. Electroluminescence imaging is more effective for hidden cell cracks, inactive areas, and broken interconnects.
Step 6: Compare results with the warranty
Use the module serial number, original datasheet, warranty curve, measured test conditions, and installer records. A warranty claim needs evidence that excludes shading, soiling, inverter faults, and measurement error.
What Does Testing and Repair Usually Cost?
Typical residential diagnostic costs range from $150-$600, while module replacement often costs more than the panel itself because labor, access, shipping, and electrical work dominate the bill. Prices vary by roof height, region, system age, and whether the installer still services the product.
| Service or component | Typical residential price | Typical time | Result |
|---|---|---|---|
| Production and visual inspection | $150-$300 | 1-2 hours | Fault shortlist |
| Thermal imaging | $250-$600 | 2-4 hours | Hotspot map |
| I-V curve testing | $300-$800 | 2-5 hours | Current-voltage diagnosis |
| Single module replacement | $400-$1,200 | 2-6 hours | Restored module capacity |
| Inverter replacement | $1,500-$4,000 | 3-8 hours | Restored conversion |
| Full array repower | $8,000-$25,000 | 1-3 days | New modules and balance of system |
A replacement makes financial sense when the lost annual energy, safety risk, or warranty recovery exceeds the repair cost. Replacing one failed module can also create electrical mismatch if its power rating differs substantially from neighboring modules, especially in older series strings.
What Output Should You Expect After 25 Years?
A panel with 0.5% annual degradation retains about 88% of its initial power after 25 years when the calculation applies a compounded annual loss. A module with 0.3% annual degradation retains about 93%, while one with 0.8% retains about 82%.
| Annual degradation after year one | Approximate year-10 power | Approximate year-25 power | Interpretation |
|---|---|---|---|
| 0.25% | 97.8% | 93.9% | Low-degradation premium range |
| 0.50% | 95.6% | 88.2% | Common planning assumption |
| 0.70% | 93.9% | 83.9% | Faster conventional range |
| 1.00% | 91.4% | 78.7% | Investigate quality or conditions |
These percentages describe module nameplate power, not annual household energy. Household energy also changes with weather, shading, inverter efficiency, battery dispatch, tariff rules, and electrical availability.
A 400-watt module retaining 88.2% at year 25 would have approximately 353 watts of rated output under standard test conditions. Real operating output can be lower or higher at a particular moment because cell temperature and sunlight vary.
Can Solar Panel Degradation Be Prevented?
Solar panel degradation cannot be eliminated, but owners can reduce avoidable losses through correct design, installation, cleaning, inspection, and warranty documentation. The highest-value prevention measure is selecting a module with credible degradation terms and installing it without mechanical stress.
Use these practitioner rules:
- Never walk, kneel, or place ladders on module surfaces.
- Keep drainage paths and roof ventilation clear.
- Use compatible connectors from the same connector family and manufacturer-approved mating parts.
- Avoid unsupported cable loops that move in wind and stress junction boxes.
- Ask for PID resistance data when designing high-voltage arrays in hot, humid climates.
- Photograph serial numbers, labels, roof conditions, and installation details.
- Clean when measured soiling justifies the labor, not on an arbitrary schedule.
- Keep tree canopies outside the sun path during the array’s productive hours.
A counterintuitive point matters here: adding panels to compensate for future degradation is often less efficient than preserving roof access and choosing a low-degradation product. Extra modules increase initial cost, wiring, structural loading, and inverter design complexity.
When Should You Replace a Solar Panel?
Replace a solar panel when testing confirms unsafe insulation, severe glass or backsheet damage, persistent hotspots, extensive delamination, or power loss that makes warranty recovery and repair economically preferable to continued operation. Do not replace a module solely because its output is lower on one cloudy day.
Prioritize immediate professional attention for:
- Cracked glass above energized cells.
- Burned connectors or junction boxes.
- Exposed conductive foil or backsheet openings.
- Repeated inverter ground-fault alarms.
- Hotspots that remain after shade and connector causes are excluded.
- Water inside the laminate.
A module can be repaired cosmetically but not reliably restored at cell level in the field. Replacing bypass diodes or connectors may correct a localized electrical fault, while microcracked silicon, corroded metallization, and severe delamination usually justify module replacement.
Frequently Asked Questions
Do solar panels lose power faster in hot climates?
Solar panels produce less instantaneous voltage at high cell temperatures, and sustained heat can accelerate solder, encapsulant, and PID stress. Heat alone does not prove abnormal degradation. Compare temperature-adjusted performance and inspect humidity, ventilation, mounting method, and module temperature coefficients before blaming climate.
Is a 1% yearly drop in solar production normal?
A 1% annual drop is higher than the common long-term planning range of roughly 0.3%-0.8% for many crystalline-silicon modules. One year cannot establish the rate, because weather and equipment availability introduce noise. A persistent weather-normalized decline above 1% deserves electrical testing and warranty review.
Can dirty solar panels look degraded?
Dirty solar panels can look degraded because dust, pollen, ash, and bird droppings reduce irradiance at the glass surface. Soiling losses are reversible and often appear across the array, while permanent degradation remains after cleaning. Compare production before and after safe cleaning under similar sunlight.
Which solar panel type degrades the slowest?
N-type HJT and TOPCon modules generally have lower published degradation rates than older P-type PERC modules, with typical later-life ranges around 0.20%-0.40% per year. The exact manufacturer warranty, encapsulant design, climate suitability, and installation quality matter more than the cell label alone.
Can solar panel degradation be reversed?
Most aging-related degradation cannot be reversed because cracks, corrosion, polymer breakdown, and permanent cell defects remain in the module. Some PID-related losses may improve through approved reverse-bias recovery procedures, but recovery is uncertain and requires professional testing before and after treatment.
Do solar panels stop working after 25 years?
Solar panels do not normally stop working at year 25. The 25-year period usually marks the end of a performance warranty, while modules may continue operating for 30 years or longer at reduced output. Replacement becomes practical when safety, reliability, roof access, or energy economics outweigh continued operation.
The Bottom Line
Solar panel output dropping over time usually reflects normal module degradation of about 0.3%-0.8% per year, but a sudden or faster decline points to soiling, shade, inverter faults, PID, microcracks, corrosion, or monitoring errors. Clean and analyze the system first, then use thermal imaging, I-V testing, and warranty evidence before replacing equipment. The causes of solar panel output dropping over time are manageable when permanent aging is separated from reversible production loss.