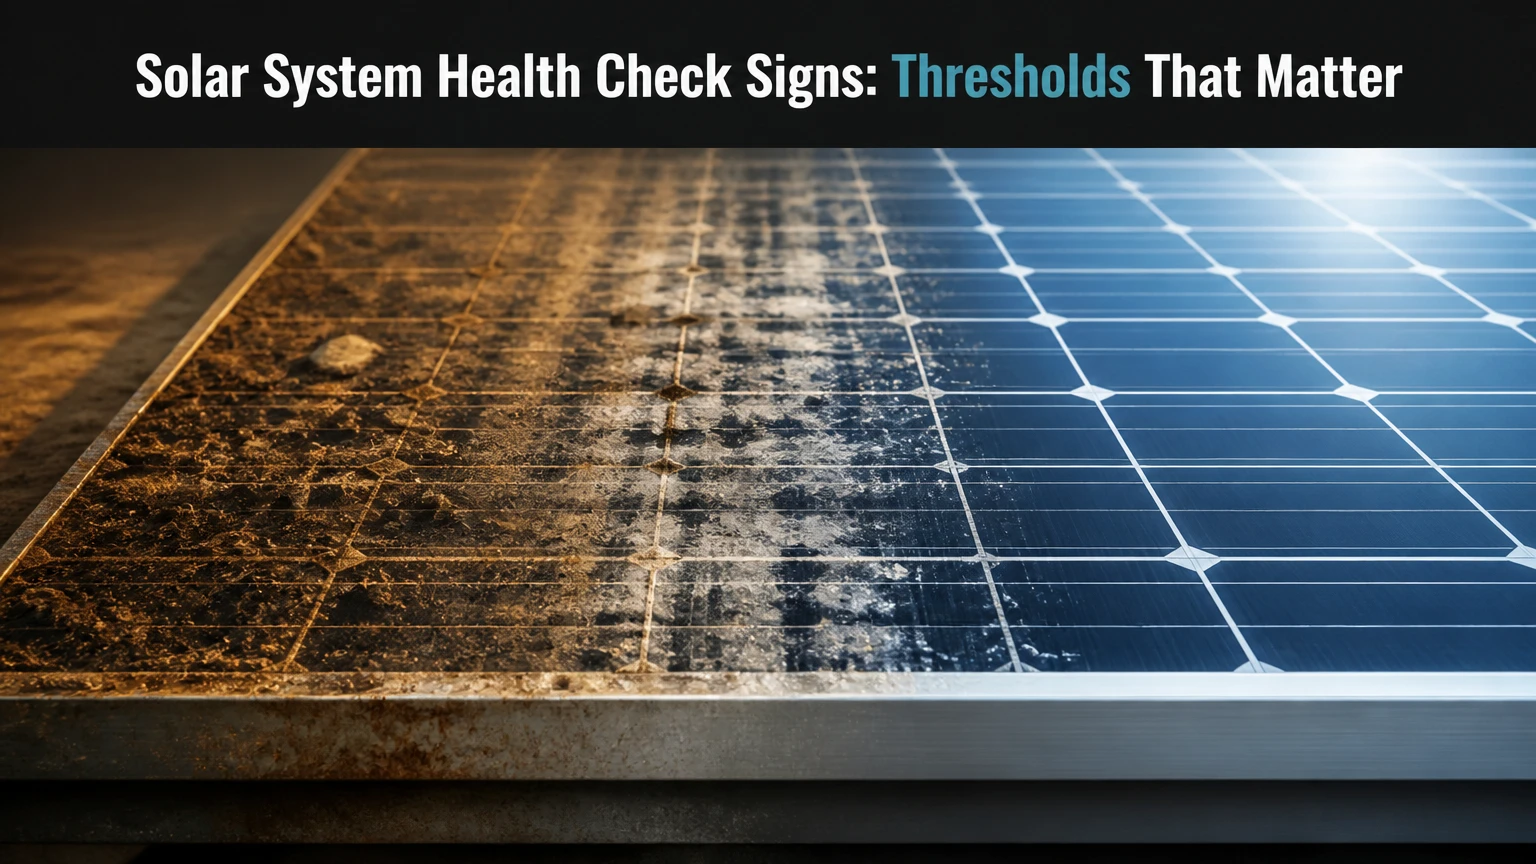
Solar system health check signs include persistent production loss, inverter errors, hot spots, visible module or wiring damage, abnormal string voltage, and unexplained battery capacity loss. A proper photovoltaic system health check combines monitoring data, visual inspection, thermal imaging, and qualified electrical tests to separate normal weather or grid behavior from equipment failure and safety hazards.
Key Facts at a Glance
- A year-over-year production decline above the expected panel degradation rate requires investigation, but weather, shading, soiling, and export limits must be excluded first.
- An inverter isolation fault, burning smell, arcing sound, melted connector, exposed conductor, or water-damaged equipment requires professional attention rather than DIY testing.
- A solar monitoring app can identify many output and communication problems, but it cannot confirm clamp torque, insulation resistance, connector heating, roof penetrations, or structural condition.
- Infrared scans are most useful when modules are operating under steady sunlight and a meaningful electrical load, often above approximately 600 W/m² irradiance.
- Typical professional residential inspections cost about $150-$300 for a basic check and $400-$800 or more for advanced thermal and electrical diagnostics.
- Performance ratio is useful only when the calculation includes accurate irradiance, temperature, system boundary, curtailment, and availability data.
What Are Solar System Health Check Signs?
Solar system health check signs are observable symptoms that indicate whether a photovoltaic installation needs routine monitoring, corrective service, or urgent electrical assessment. The signs include energy trends, inverter status, module condition, wiring condition, thermal patterns, string measurements, and battery behavior.
A health check is broader than asking whether panels produce electricity today. A system can show normal instantaneous power while retaining a loose connector, deteriorating backsheet, rodent-damaged cable, or mounting defect. Conversely, low output on a cloudy afternoon may be entirely normal.
The practical objective is to establish a chain of evidence:
- Confirm the system is available.
- Compare production with a valid expected baseline.
- Locate the affected subsystem.
- Test whether the fault is performance-related, structural, or electrical.
- Document the repair and verify recovery.
The International Electrotechnical Commission standard IEC 62446-1 provides a framework for PV system documentation, commissioning tests, and inspection. A health check does not replace the original electrical design record, local code inspection, manufacturer instructions, or utility requirements.
Which Signs Need Immediate Attention?
An isolation fault, visible arcing, smoke, burning odor, melted insulation, exposed live wiring, water inside electrical equipment, or a rapidly overheating connector requires immediate professional escalation. Do not touch the array frame, disconnect plugs, remove covers, or use a household multimeter on unfamiliar DC circuits.
A complete loss of production is less specific. The cause may be a tripped breaker, inverter failure, communications outage, utility shutdown, grid overvoltage, or a fault in the array. The safe first action is to read the inverter message and check accessible breakers without opening equipment.
| Observed sign | Likely categories | Safe homeowner action | Escalation |
|---|---|---|---|
| No AC production for 1-2 daylight periods | Breaker, grid, inverter, communications | Check app timestamp and accessible breaker | Service call if unresolved |
| 30%-50% lower output in clear weather | String fault, shading, severe soiling, inverter limit | Compare irradiance and historical curves | Diagnostic visit |
| Ground fault or isolation fault | Damaged cable, wet connector, insulation failure | Keep away from equipment | Urgent qualified technician |
| Burning smell or crackling sound | Arc fault, overheated connector, failed terminal | Move clear and follow shutdown instructions | Immediate electrical response |
| One module visibly cracked | Impact, thermal stress, transport damage | Photograph from ground level | Module and insulation assessment |
| Battery swelling or unusual heat | Cell failure, charging fault, enclosure issue | Stop interacting with battery | Manufacturer-qualified service |
A tripped breaker should not be repeatedly reset. Repeated trips indicate an unresolved electrical or equipment problem, and resetting the circuit can increase fire risk.
How Does a Professional Health Check Work?
A professional PV health check normally follows five stages: historical analysis, visual inspection, thermal imaging, electrical testing, and inverter or battery review. The sequence matters because data analysis narrows the search before technicians perform targeted tests.
Stage 1: Audit Production and Operating History
The technician reviews daily and monthly generation, inverter uptime, alarm logs, weather data, export limits, and previous service records. Same-month comparisons are more useful than comparing January with July, while a weather-normalized model such as NREL PVWatts can provide a screening estimate rather than a guaranteed target.
A valid comparison accounts for new shade, snow, smoke, soiling, panel replacement, battery charging, demand-control settings, and utility export restrictions. A monitoring outage can create an apparent production loss even when the array continued generating.
Stage 2: Inspect the Array and Balance of System
The visual inspection covers module glass, frames, backsheets, junction boxes, connectors, cable management, racking, roof attachments, inverter enclosures, isolators, and battery cabinets. Technicians also look for bird nesting, rodent damage, corrosion, cracked sealant, standing water, vegetation, new shadows, and displaced clamps.
Racking bolts should be checked against the manufacturer’s torque specification, not tightened by feel. Over-tightening can deform frames, while under-tightening can permit movement and fatigue.
Stage 3: Scan for Thermal Anomalies
Infrared thermography compares surface temperatures across modules, strings, connectors, fuses, combiner boxes, and inverter terminals. A hot cell, junction box, connector, or cable can indicate resistance, a bypass-diode problem, an open circuit, a poor crimp, or a mismatch.
Thermal imaging needs a suitable operating state. Steady sunlight, adequate irradiance, minimal wind, and a meaningful current load improve detection. A scan during weak diffuse light may miss faults, while reflections, glass angle, wind, dirt, and different module materials can create false patterns.
Thermal imaging cannot prove the exact internal cause. A qualified technician combines the image with electrical measurements and physical inspection.
Stage 4: Perform Electrical Safety and Performance Tests
Testing may include polarity, continuity, open-circuit voltage, short-circuit current, insulation resistance, earth continuity, protective-device checks, and I-V curve tracing. These tests can identify string imbalance, resistance, wiring faults, degraded modules, and leakage paths.
Only trained personnel with appropriate PV-rated equipment should perform live DC testing. PV strings can remain energized in daylight even when an inverter is switched off, and opening connectors under load can create an arc.
Stage 5: Review Inverter and Battery Analytics
The technician examines error history, firmware status, operating temperature, fan condition, terminal connections, clipping behavior, grid voltage, reactive-power settings, and communications. For batteries, the review may include state of charge, usable energy, charge and discharge power, temperature history, cell balance, cycle count, and state-of-health estimates.
| Diagnostic method | Main measurement | Finds well | Important limitation |
|---|---|---|---|
| Monitoring review | kWh, uptime, alarms, power curve | Outages, recurring derating, communications loss | Cannot inspect physical hardware |
| Visual inspection | Module, cable, rack, enclosure condition | Cracks, corrosion, shade, poor cable routing | Misses many hidden electrical faults |
| Infrared thermography | Relative surface temperature | Hot connectors, cells, diodes, fuses | Needs load and suitable weather |
| I-V curve tracing | Current-voltage response | Mismatch, resistance, string behavior | Requires specialist equipment and interpretation |
| Insulation resistance test | Leakage resistance to earth | Wet or damaged insulation, ground faults | Must follow equipment and code limits |
| Battery diagnostic | Capacity, temperature, cell behavior | Reduced storage, imbalance, thermal issues | Reported SOH depends on battery software |
What Production Change Is Abnormal?
A production decline becomes suspicious when it exceeds the system’s expected degradation after weather, shading, soiling, curtailment, and availability are removed. Modern module degradation is often approximately 0.25%-0.5% per year for some n-type products and approximately 0.5%-0.8% for many older p-type products, but the warranty datasheet for the installed module is the controlling reference.
A 2% annual decline is not automatically proof of a hardware fault. A new tree shadow, repeated inverter downtime, smoke exposure, or export cap can produce a larger loss without panel degradation.
| Metric or sign | Typical interpretation | Qualification | Action |
|---|---|---|---|
| Module degradation | 0.25%-0.5% per year for many n-type products | Confirm product warranty | Trend annually |
| Older module degradation | 0.5%-0.8% per year is a common planning range | Product and climate vary | Investigate sustained excess |
| Performance ratio | Often 75%-90% in well-functioning systems | Boundary and climate determine value | Compare against own baseline |
| Year-over-year loss | More than 1.5%-2% merits review | Weather and shading must be normalized | Analyze before replacing parts |
| Inverter clipping | Flat output at AC nameplate limit | Common with DC oversizing | Not a fault by itself |
| Availability | Repeated downtime lowers annual yield | Communications data may be incomplete | Review alarm duration |
Performance ratio is not a universal pass-fail score. PR commonly falls during hot weather because module voltage decreases, and it can change with snow, inverter clipping, low-light response, soiling, and whether the calculation includes availability losses. A site-specific baseline is more reliable than importing a 70% threshold from another system.
What Can a Homeowner Safely Check?
A homeowner can review monitoring data, record error messages, inspect equipment from ground level, check for new shade, note unusual sounds or smells, and compare utility bills with system production. A homeowner should not climb onto a roof, open an inverter, disconnect MC4 connectors, remove battery covers, or perform insulation and high-voltage tests.
Start with a seven-day evidence log. Record date, weather, app production, inverter status, error codes, visible shade, and whether the home experienced a power outage. Screenshots preserve transient warnings that may disappear before a technician arrives.
Monitoring Checks
Look for missing data, repeated zero-production periods, jagged midday curves, one-sided string behavior, and recurring fault codes. A missing app value does not necessarily equal missing generation, so compare the inverter display, utility meter, and monitoring portal where available.
Ground-Level Visual Checks
Use binoculars or a phone camera from a safe location. Look for broken glass, darkened cells, lifted cables, nesting, new shadows, water stains, loose-looking panels, and damaged conduit. Never infer that a cable is safe because its insulation appears intact.
Utility and Grid Checks
Confirm whether nearby homes also lost power. Grid overvoltage, frequency events, export-control settings, and utility outages can stop an otherwise healthy inverter. A technician can distinguish grid conditions from equipment faults through event logs and AC measurements.
How Much Does a Solar Health Check Cost?
A typical basic residential health check costs approximately $150-$300 and takes 1.5-3 hours. Advanced testing with thermal mapping, I-V curves, insulation resistance, roof access, or battery capacity assessment typically costs about $400-$800 or more, with commercial sites priced according to array size and reporting requirements.
Prices vary by region, roof complexity, travel, test scope, and whether repairs are included. A low quote may cover only a visual visit, while a higher quote may include a formal report, drone imagery, string-level testing, and warranty documentation.
| Service scope | Typical price | Typical duration | Usually includes |
|---|---|---|---|
| Monitoring review only | $0-$75 | 30-90 minutes | Portal data and alarm screening |
| Basic residential inspection | $150-$300 | 1.5-3 hours | Visual, inverter, basic electrical review |
| Thermal and string diagnostics | $400-$800+ | 3-5 hours | IR scan, I-V testing, targeted measurements |
| Battery-focused assessment | $250-$700+ | 2-4 hours | Logs, temperature, capacity or SOH review |
| Commercial survey | $800-$3,000+ | Half to multiple days | Drone, string analytics, report, sampling or full testing |
Ask for the deliverables before booking: measured values, photographs, fault locations, test conditions, recommended priority, and confirmation of whether repairs are quoted separately.
Which System Architecture Changes the Diagnosis?
String inverters concentrate several module strings at one conversion point, so one failed string can reduce output sharply while the inverter still operates. Microinverters convert power at each module, making module-level monitoring more useful and often limiting a single failure to one panel, although communications and rooftop connector faults remain possible.
Hybrid systems add battery, backup-load, transfer-switch, and energy-management variables. A battery may charge from solar and reduce exported power, so a low grid-export figure does not prove low solar production.
| Architecture | Fault signature | Best first data source | Common blind spot |
|---|---|---|---|
| String inverter | Large step loss from one string | String voltage and inverter logs | Module-level faults can be masked |
| Microinverters | One or several low-producing modules | Module-level portal data | Gateway or communications failure |
| Hybrid inverter | Solar, battery, and grid flows change together | Energy-management history | Export does not equal generation |
| DC-coupled battery | PV power may route directly to storage | Battery and inverter logs | Curtailment can resemble low array output |
| AC-coupled battery | Separate solar and battery inverters | Both inverter portals | Multiple availability records needed |
How Often Should a System Be Checked?
Most homeowners should review monitoring monthly, inspect ground-visible conditions after severe weather, and arrange a professional inspection every two to three years or sooner when warning signs appear. Commercial, coastal, agricultural, high-dust, wildfire-prone, and battery installations often justify annual review.
A scheduled check should also follow roof work, hail, flooding, lightning, nearby construction, inverter replacement, unexplained bill increases, or a change in tree height. Manufacturer warranties may specify maintenance or documentation requirements, but warranty validity depends on the product and jurisdiction.
| System situation | Monitoring interval | Professional interval | Extra trigger |
|---|---|---|---|
| Standard home PV without battery | Monthly | Every 2-3 years | Storm or persistent output loss |
| Home PV with battery | Monthly | Every 1-2 years | Heat, swelling, or capacity decline |
| Coastal or high-corrosion site | Monthly | Annually | Salt deposits or corrosion |
| Commercial rooftop | Daily automated alerts | Annually | String variance or downtime |
| Agricultural or dusty site | Weekly in dusty seasons | Annually | Soiling and rodent activity |
| Older system beyond warranty | Monthly | Annually or biennially | Any new alarm or insulation concern |
What Are the Most Common Diagnostic Mistakes?
The most common mistakes are treating app data as a complete inspection, comparing unlike weather periods, confusing clipping with failure, and washing hot modules with cold water. Correct diagnosis depends on system architecture, test conditions, and the difference between energy generated and energy exported.
Mistaking Clipping for a Fault
Clipping appears as a flat midday AC curve at the inverter’s rated output while the DC array could produce more. It is expected when the array’s DC-to-AC ratio is intentionally high. Clipping becomes suspicious when the flat limit appears at an unusually low value or begins under weak irradiance.
Ignoring New Shade
A tree can grow into the solar window after installation. Partial shade on a single cell or module can activate bypass behavior and reduce string energy disproportionately, especially in a series-connected string.
Washing Hot Modules
Do not deliberately spray cold water onto very hot modules. Thermal gradients can stress glass and seals, while rapid evaporation can leave mineral deposits. Clean at a cool time using the module manufacturer’s method, safe water, and appropriate roof-access controls.
The stronger claim that cold water instantly fractures every hot panel is not supported as a universal rule. The risk depends on temperature difference, glass condition, water volume, and module construction.
Resetting Faults Repeatedly
Repeated resets can conceal the duration of a fault and stress equipment. Record the code first, follow the manufacturer’s user-level shutdown procedure, and arrange qualified testing when the fault returns.
Using an Infrared Camera as Proof
A consumer thermal camera can locate a suspicious area, but emissivity, reflections, wind, angle, load, and weather affect the image. Thermal evidence should guide inspection rather than determine replacement by itself.
What Should the Inspection Report Contain?
A useful report identifies the array, inverter, battery, test date, weather conditions, equipment serial numbers, instruments, measured values, photographs, fault severity, and recommended next action. A report that says “system looks fine” without test conditions or recorded values has limited warranty and maintenance value.
The report should distinguish observation from diagnosis. “Connector 18°C warmer than adjacent connectors” is an observation; “high-resistance crimp likely” is an interpretation that should be confirmed through electrical testing.
Recommended Priority Levels
- Monitor: minor soiling, expected clipping, normal degradation, or a communications issue with confirmed generation.
- Schedule service: persistent underproduction, new shade, recurring inverter derating, damaged cable management, or abnormal thermal pattern.
- Urgent response: isolation fault, arc warning, exposed conductor, melted connector, smoke, water ingress, battery swelling, or severe overheating.
FAQ
Can solar panels work while the monitoring app shows zero?
Yes. A portal outage, failed gateway, internet interruption, or data-server problem can show zero production while the inverter continues operating. Compare the inverter display and utility meter, if accessible, and review whether the portal records a communications alarm rather than an equipment fault.
Does rain clean solar panels sufficiently?
Rain removes some loose dust but often leaves pollen, bird deposits, salt, and mineral residue. Soiling losses vary by climate and tilt. Ground-level inspection and production trends provide better evidence than assuming every rainfall restored the array to its original condition.
Can one bad panel reduce an entire string?
Yes. Series-connected modules share current, and a faulty module, bypass diode, connector, or shaded cell can reduce the string’s operating point. The actual loss depends on the fault and inverter design, so string measurements and I-V tracing are more informative than panel appearance alone.
How long does a solar inspection report remain useful?
A report accurately describes conditions on its inspection date, but electrical and weather-exposed components can change afterward. For a typical home, a report remains a useful maintenance record for two to three years, while storm damage or a new alarm warrants a fresh assessment.
Should a solar health check include the roof?
It should include visible roof penetrations, flashing, cable routes, and mounting areas when safely accessible. A PV technician is not automatically a roofing specialist, so leaks, damaged shingles, membrane defects, or structural concerns may require a qualified roofer or structural professional.
The Bottom Line
Solar system health check signs become meaningful when production data, physical evidence, and electrical testing agree. Persistent losses above expected degradation, repeated inverter alarms, abnormal thermal patterns, damaged components, and battery capacity decline justify a professional assessment, while isolation faults, arcing, smoke, exposed conductors, and swelling batteries require urgent escalation.
Use monitoring for trends, not proof of safety. A complete solar system health check combines historical analysis, visual inspection, thermal imaging, qualified electrical tests, and inverter or storage diagnostics, then records the conditions and measurements needed to verify the repair.