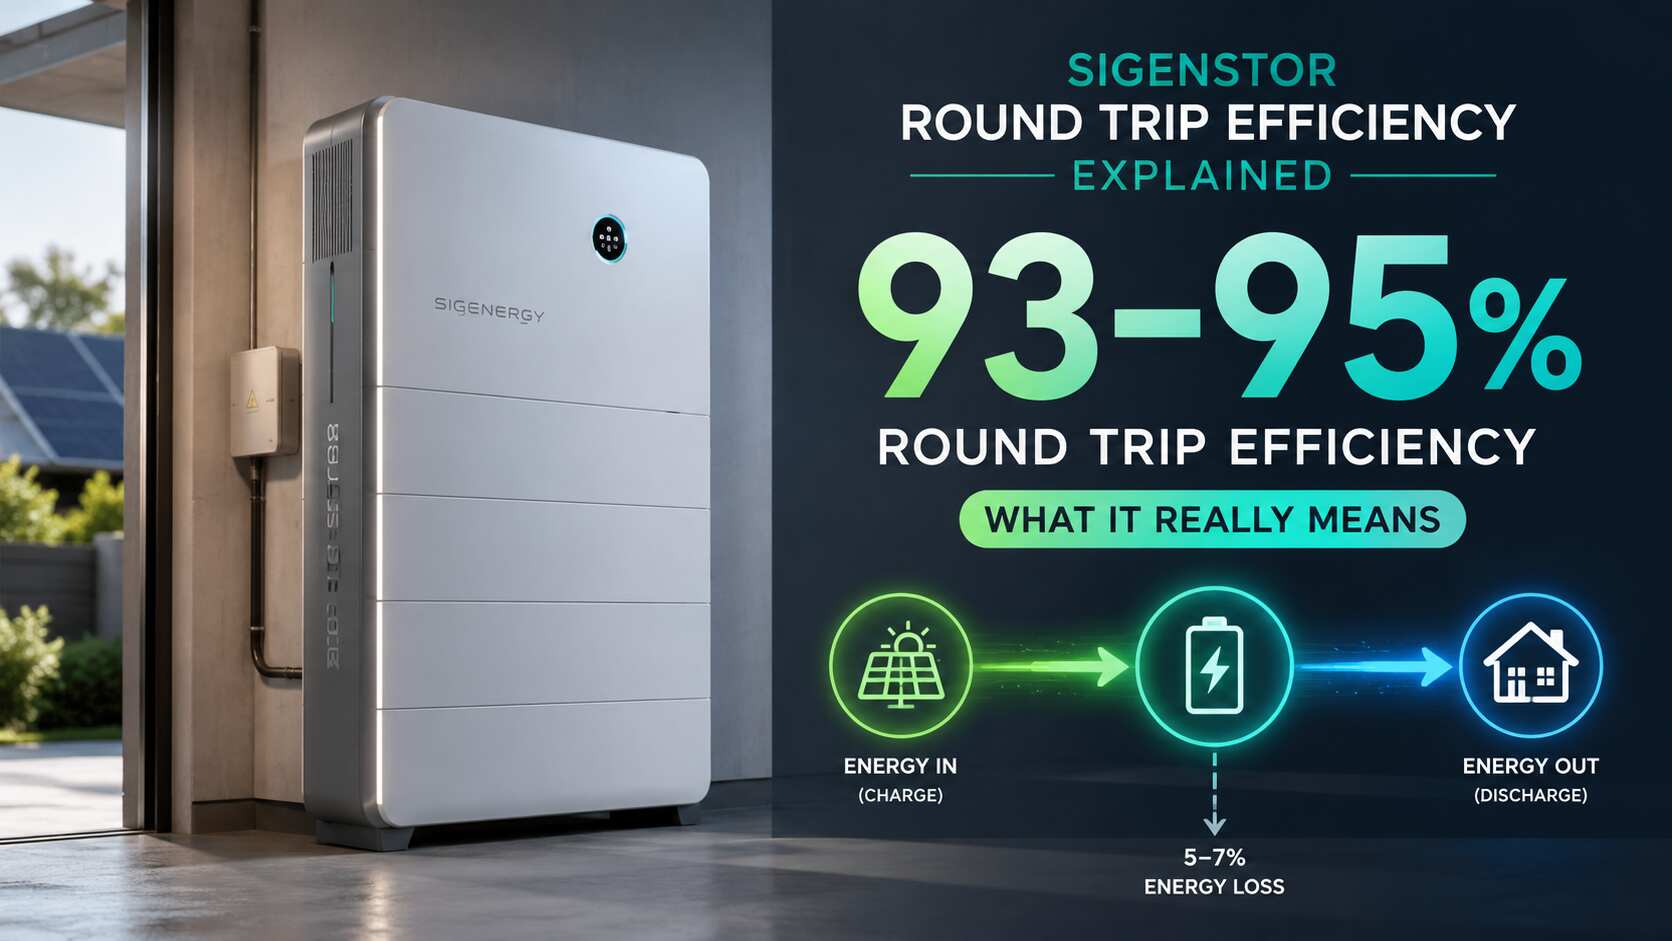
Every battery quote you receive will wave a percentage at you. Almost none of them will tell you how that percentage was measured, what it excludes, or how much of it actually reaches your kettle. That gap is where money quietly disappears.
This guide breaks down the Sigenergy SigenStor round trip efficiency figure of 93% to 95%, explains the engineering behind it, and shows you the one calculation that matters more than the headline number. By the end you will be able to interrogate any battery quote in about ninety seconds.
What Round Trip Efficiency Actually Measures in a Home Battery
Round trip efficiency (RTE) is the ratio of energy you get back out of a battery to the energy you put in.
RTE = (energy discharged ÷ energy charged) × 100
Put 10 kWh in, get 9.4 kWh back, and your round trip efficiency is 94%. The missing 0.6 kWh became heat during charging, chemical conversion, thermal management and discharging.
The critical detail almost no brochure explains is the measurement boundary. Three very different numbers get printed under the same label:
- DC to DC (cell level): battery in, battery out. LFP cells alone typically test at 96% to 98%. The flattering number.
- AC to AC (system level): grid or house in, house out. This includes both inverter conversions and is the number your electricity bill responds to. Usually 4 to 8 points lower than the cell figure.
- Solar DC to AC (real world): what a DC coupled system like SigenStor actually does most days, skipping one conversion entirely.
When Sigenergy and its installers quote 93% to 95% for the SigenStor, that sits in the AC-to-AC to DC-coupled band, which is the meaningful one. Compare it only against other manufacturers’ AC-to-AC figures, never against a cell-level claim.
Why the DC Coupled Battery System Design Wins Back Energy
A traditional AC coupled retrofit battery forces your solar energy through an obstacle course:
Panels (DC) → solar inverter (AC) → battery inverter (DC) → cells → battery inverter (AC) → home
That is four conversions before the energy lights a bulb, and each one skims roughly 2% to 3%.
The SigenStor uses a unified DC coupled architecture managed by the Sigen Energy Controller, a hybrid inverter with a peak conversion efficiency of up to 97.6%:
Panels (DC) → controller MPPT → cells (DC) → controller (AC) → home
Two conversions instead of four. In practice this recovers around 2% of every stored solar kilowatt hour compared with older AC coupled setups, and it removes an entire box, its standby draw and its cabling losses from the wall.
Peak Efficiency vs Weighted Efficiency: The Question to Ask Your Installer
Fig. 1 / Hybrid inverter conversion efficiency
Peak efficiency happens at one load point. Your battery rarely sits there.
Tap a point to read its value
- Peak 97.6% is a single point on the curve, near half load.
- Weighted efficiency averages across the load range. It is the fairer comparison.
- Overnight loads of 300 to 800 W often sit below 20% of rated power, where the curve sags.
| Load | Efficiency | Typical household moment |
|---|---|---|
| 5% | 88.5% | Standby, router and fridge only |
| 10% | 92.5% | Overnight discharge |
| 20% | 95.6% | Evening TV and lighting |
| 50% | 97.6% | Oven or fast grid charging |
| 100% | 96.8% | Full output, EV charging |
A 97.6% peak figure is achieved at one specific load point, usually somewhere around half to three quarters of rated power. Efficiency curves sag at very low loads.
This matters because a home battery spends much of its life trickling 300 to 800 watts to a fridge, router and standby loads overnight, not blasting out 6 kW. Ask your installer for the European weighted efficiency or the efficiency curve at 10% and 20% load rather than the headline peak. Sigenergy’s larger internal inverter capacity is an advantage on fast charging, but any oversized inverter running a tiny overnight load will sit lower on its curve. Sizing the system to your actual consumption pattern protects the number you paid for.
The 100% Depth of Discharge Battery Advantage Most Reviews Miss
Round trip efficiency is only half of the story. The other half is how much of the battery you are allowed to touch.
Many LFP competitors reserve the bottom 10% to 20% of capacity. The stated reasons are cell protection and longevity. The unstated reason is that LFP cells have a famously flat voltage plateau between roughly 20% and 80% state of charge, which makes accurate state-of-charge estimation difficult. Holding a buffer hides that imprecision.
Sigenergy’s approach, documented in its technical note on 100% depth of discharge, is to run periodic full charge and discharge checkups so the battery management system can recalibrate against the steep voltage regions at the top and bottom of the curve. The result is that the advertised capacity is closer to the delivered capacity.
The Calculation That Beats the Headline Number
Combine both factors into what I call effective delivered energy per cycle:
Nominal capacity × usable depth of discharge × round trip efficiency
Two 10 kWh batteries, one quoted at 89% RTE with 90% usable depth, one at 94% with full depth:
| Metric | Typical AC coupled rival | Sigenergy SigenStor |
|---|---|---|
| Nominal capacity | 10.0 kWh | 10.0 kWh |
| Usable depth of discharge | 90% | ~100% |
| Round trip efficiency | 89% | 94% |
| Delivered per full cycle | 8.0 kWh | 9.4 kWh |
That is roughly 17% more usable energy per cycle from the same nameplate size. Over 300 cycles a year it is around 420 kWh, worth approximately £110 to £115 annually at a 27p peak import rate, or well over £1,000 across a ten year holding period. One caveat worth applying to every brand: check whether the quoted capacity is nominal or already-usable, because comparing a nominal figure against a usable one will flatter the wrong product.
Thermal Management, Standby Draw and the Losses Nobody Advertises
Two real world drains rarely appear in comparison tables.
Thermal management. LFP charging efficiency falls in cold conditions and cells should not be fast charged below freezing. The SigenStor includes integrated thermal regulation to hold cells in their optimal band, which protects efficiency in an unheated garage or exposed external wall in January. Heating and cooling draw a little energy themselves, which is one reason the honest system figure sits below the cell figure.
Standby and parasitic consumption. Controllers, communications, monitoring and cooling run continuously. A system idling at 20 watts consumes roughly 175 kWh a year, which can quietly cancel a chunk of an efficiency advantage. Because SigenStor consolidates the solar inverter, battery inverter and energy management into one stack, it removes a second always-on device from the equation. Ask any supplier for measured self-consumption in watts.
Cycling depth. Efficiency is best on deep, steady cycles. Systems that chase every small tariff arbitrage with lots of shallow partial cycles spend proportionally more time in inverter overheads.
What Owners Actually Report: Real World SigenStor Performance
Themes that consistently appear in owner discussion:
- Measured efficiency generally lands in the low 90s in app data over a full month, with individual days dipping when overnight loads are very light. Owners who log at the meter rather than in the app tend to report figures 1 to 2 points below the brochure, which is normal for every brand.
- The mySigen app and AI tariff optimisation attract the strongest praise. Automatic cross referencing of weather forecasts against agile tariff pricing, plus fast force-charging during cheap windows, is the feature owners say they would miss most.
- Whole home backup with sub-10ms changeover is repeatedly described as the differentiator against rivals that back up only a small essentials circuit.
- The recurring criticism is architectural. A unified DC coupled stack means the controller is a single point of failure: if it goes down you lose solar generation and battery access together until it is serviced.
- Installation quality dominates outcomes. Sigenergy issued a voluntary recall in late 2025 covering certain single phase quick-connect AC plugs that could overheat if poorly fitted, addressed through a hardware revision and a certified installer remediation programme. Owner reports overwhelmingly link problems to commissioning quality rather than the cells.
- Weight and siting surprise people. A fully stacked tower runs to hundreds of kilograms and needs a solid floor or engineered wall fixing.
How SigenStor Efficiency Compares to Rival Home Batteries
| Brand / model | Coupling | Typical quoted RTE | Structural advantage |
|---|---|---|---|
| Sigenergy SigenStor | DC coupled hybrid | 93% to 95% | 5-in-1 stack, ~100% DoD, optional bidirectional DC EV charger, up to 97.6% peak inverter efficiency |
| Tesla Powerwall 3 | Integrated hybrid | ~89% to 97% depending on boundary quoted | Mature ecosystem, long track record |
| Fox ESS | Modular, AC or DC | Around 88% to 92% AC-to-AC | Budget friendly, flexible modules |
| Anker Solix X1 | Modular hybrid | Around 90%+ | Premium finish, strong build quality |
| Generic AC retrofit | AC coupled | 85% to 90% | Works with existing solar inverter |
Seven Ways to Protect Your SigenStor Round Trip Efficiency
- Size the inverter to your loads, not just your solar array, so overnight discharge does not sit at the bottom of the efficiency curve.
- Site the stack somewhere thermally stable. An insulated garage beats a north facing exterior wall.
- Use DC coupling on new installs. Retrofitting AC coupled around an existing inverter forfeits the main advantage.
- Allow periodic full cycles so the BMS can recalibrate rather than blocking every deep discharge.
- Prefer fewer deep cycles to many shallow ones when configuring tariff arbitrage.
- Keep firmware current. Efficiency and scheduling logic are improved through updates.
- Insist on a certified installer and check torque, cable sizing and any recall remediation at commissioning.
Frequently Asked Questions
Is 93% to 95% good for a home battery? Yes. Measured AC-to-AC, most residential batteries land between 85% and 92%, so the SigenStor sits at the upper end.
Does round trip efficiency fall as the battery ages? Mildly. Capacity fade is the larger effect over time; efficiency typically declines by a small margin as internal resistance rises.
Does the SigenStor really deliver 100% depth of discharge? It is designed to make effectively the full nominal capacity usable through BMS recalibration. Confirm on your specific model’s datasheet whether the stated kWh is nominal or usable.
Is efficiency or capacity more important? Effective delivered energy per cycle, which combines capacity, depth of discharge and efficiency, is the metric that determines your savings.
Conclusion
The Sigenergy SigenStor round trip efficiency of 93% to 95% is real, but it is not the whole reason the system performs well. Fewer conversions through a DC coupled architecture, close to full depth of discharge, integrated thermal management and one less always-on device combine to deliver noticeably more usable energy per cycle than the nameplate comparison suggests. For a new solar installation, especially one with an EV and a dynamic tariff, that compounding advantage is where the payback comes from. For a household that simply wants a cheap AC box bolted alongside a working inverter, the premium is harder to justify.
Next Step
Ask any supplier for three numbers before you sign: AC-to-AC round trip efficiency, usable kWh (not nominal), and standby consumption in watts. Run them through the effective delivered energy calculation above.
Book a free efficiency assessment with our certified Sigenergy installers and we will model your actual consumption profile, your tariff and your roof to show exactly what a SigenStor would deliver in your home.